
Welcome.
I'm David Lacroix, Geo data engineer @MeilleursAgents
the constraints
- volume
- coverage
- flexibility
- simplicity
How is it being done ?
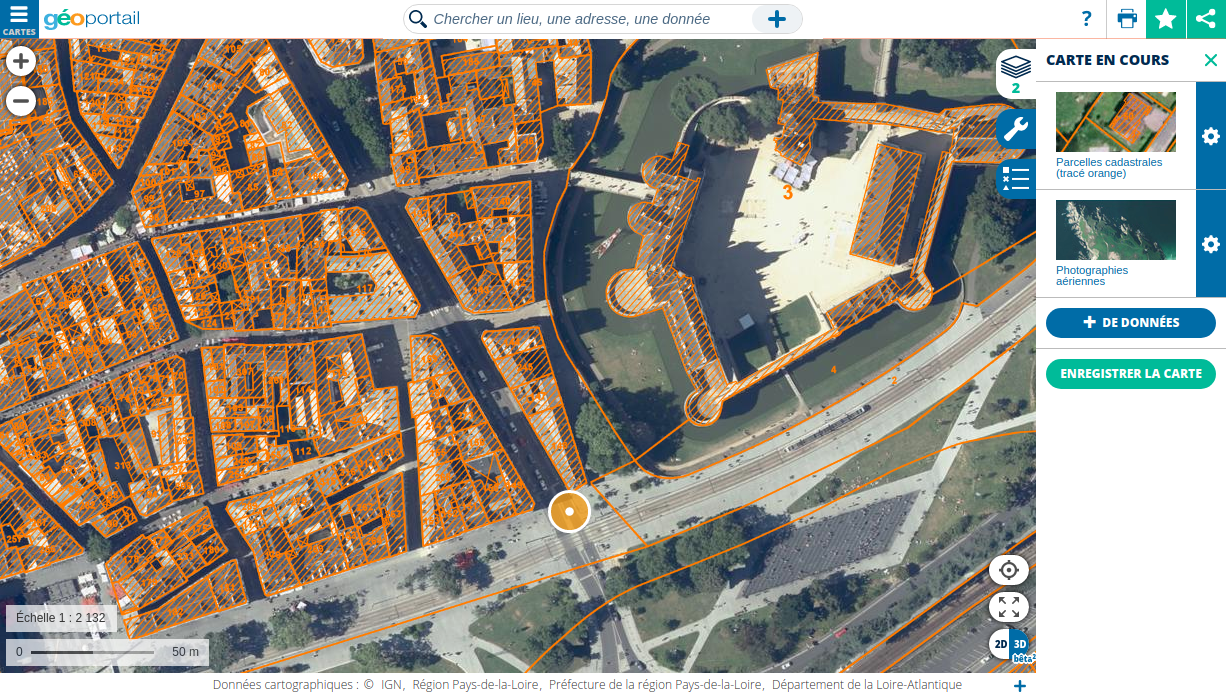 WMTS + IGN js api @Geoportail
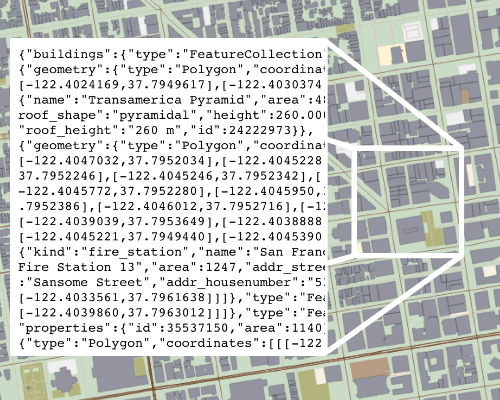
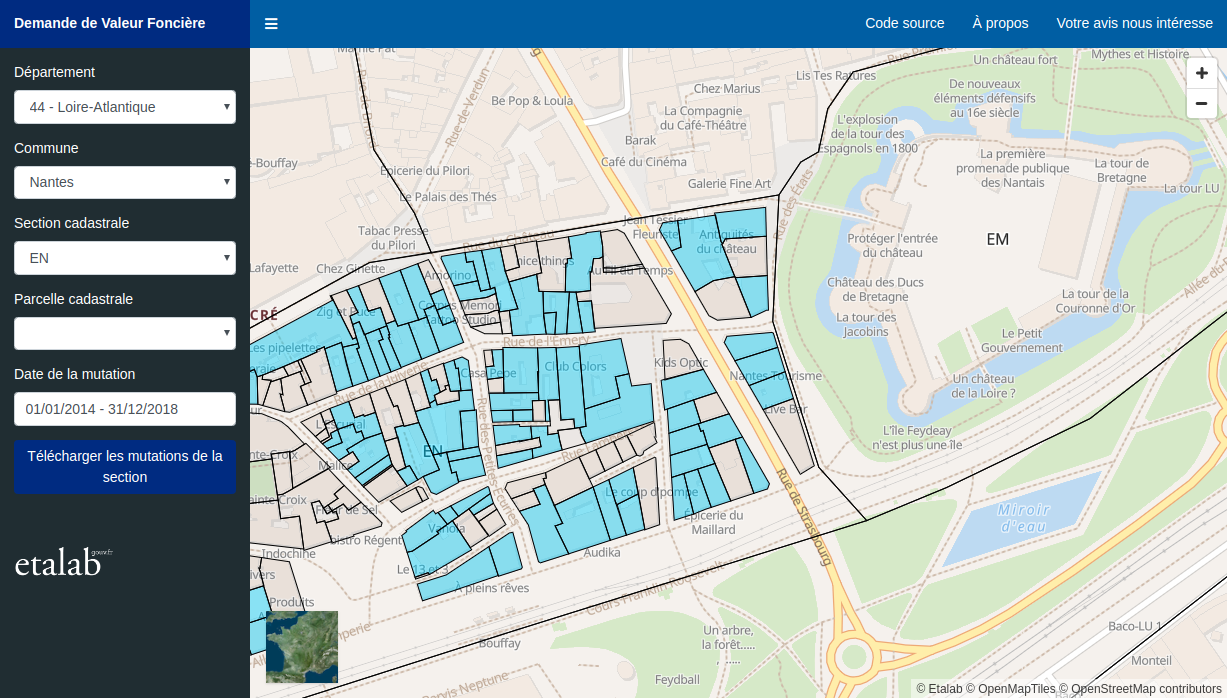 Geojson + Mapboxgl.js @Etalab
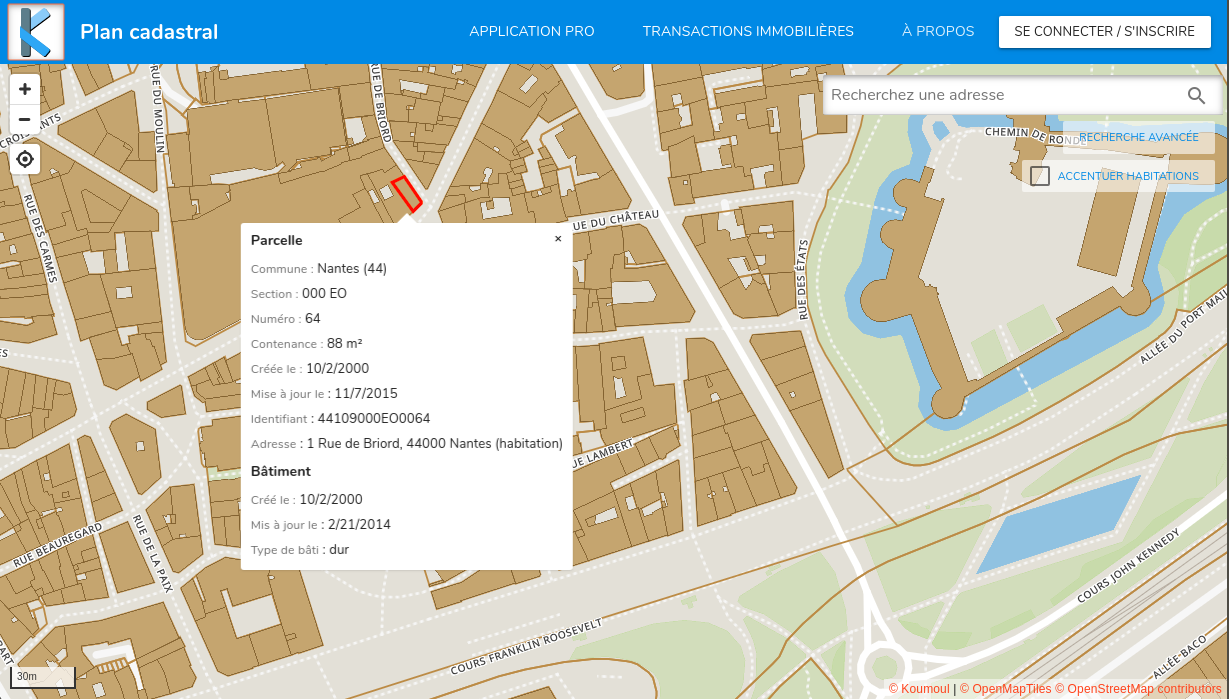 Vector tile + Mapboxgl.js @Koumoul
the realm of vector tiles
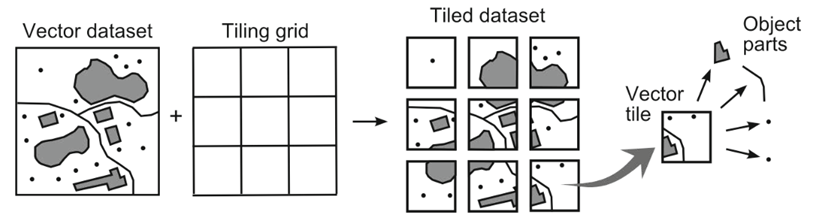 Source Gaffuri (2012)
light, fast and adaptable
 Source Mapzen
a standard architecture
a bright future ahead
 OGC - Vector Tiles Pilot
our stack
Postgres |
↦ | Flask |
↦ | MapboxGL |
your only friend
 find more information in that great tutorial
a calf on steroid
- 2.4.0: introduction of ST_AsMVT()
- 2.5.0: parallel implementation
- 3.0.0: performance boost + ST_TileEnvelope()
read more from Paul Ramsey
one less middleware
your web application is your tile server
#madewithmapbox

mapbox vector tile specification
try it out
$ sudo docker-compose up -da map speaks louder than words
http://localhost:8001/map_emptygeojson is trivial
                            map.on('load', function () {
                              map.addLayer({
                                "id": "haussmann",
                                "type": "fill",
                                "source": {
                                  "type": "geojson",
                                  // path to geojson (text, file, url...)
                                  "data": "static/resource/haussmann.geojson"
                                },
                                "paint": {
                                  "fill-color": "#088",
                                  "fill-opacity": 0.8
                                }
                              });
                            });
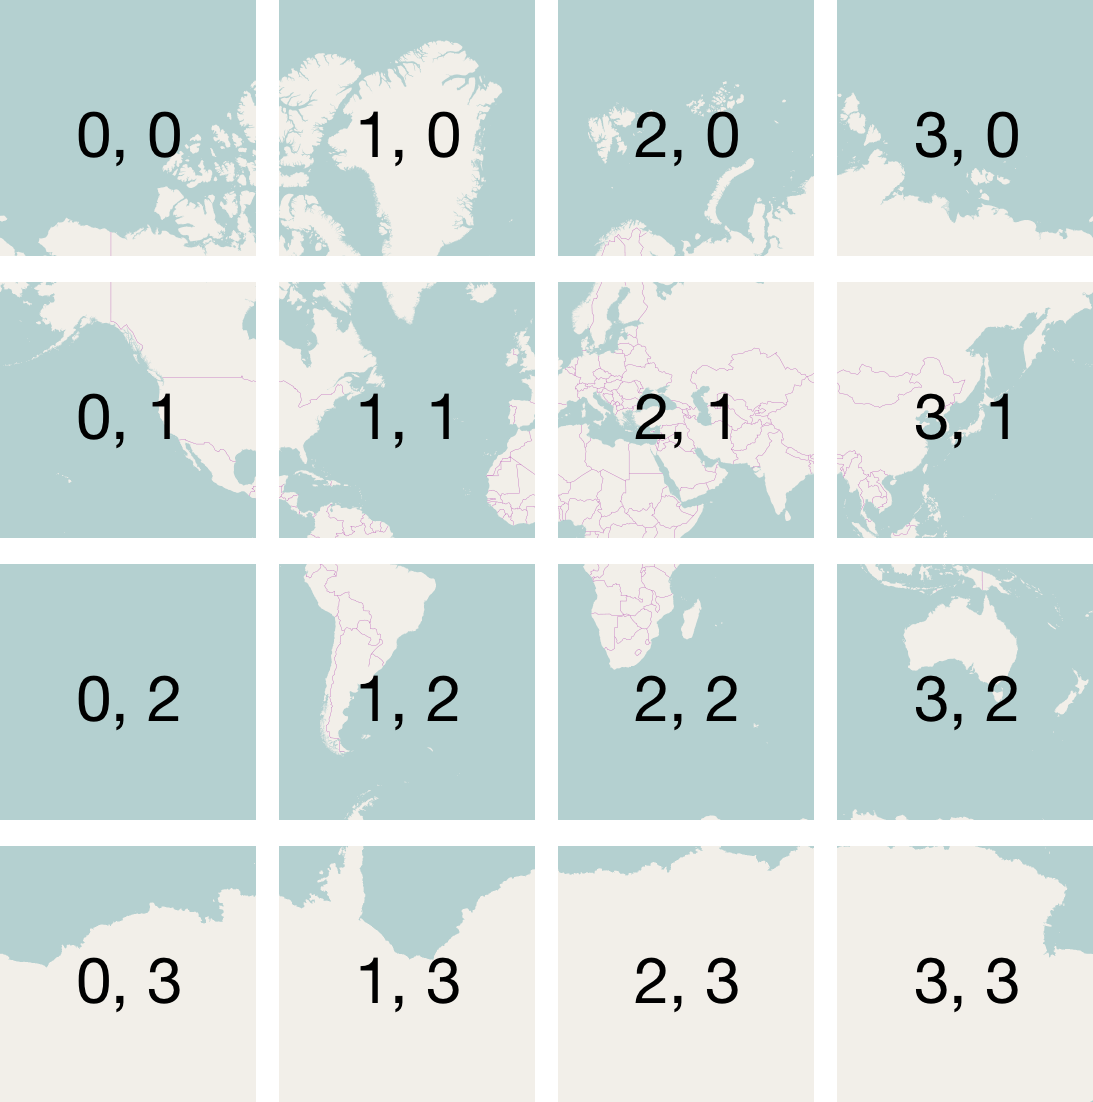
tiles are trickier
                                http://localhost:8001/my-layer/{z}/{x}/{y}
                                # z: zoom level (0-22)
                                # x: tilegrid X coordinate
                                # y: tilegrid Y coordinate
flask ↦ serving tiles
flask ↦ loading tile
from tile to ground coordinates
 read more from Paul Ramsey
postgis ↦ creating tile
pick your layer
best served hot
http://localhost:8001/map_apurdata driven styles
http://localhost:8001/map_apur?show_color=truereusing the data-source
labelling entities
handling interactions
displaying interactions
the FeatureID issue

refer to mapbox hover tutorial
fixed in postgis 3
https://trac.osgeo.org/postgis/ticket/4128rebuild mapbox-gl-js
https://github.com/mapbox/vector-tile-js/blob/master/lib/vectortilefeature.js#L19Debugging tile
Scaling 🚀
read more mapnik vs postgis
leaving the demo
$ sudo docker build -t data-master data-processing/$ sudo docker run \
--link=postgres-master \
--network=global-network \
--env-file .env \
-it data-master